NetEye SIEM
Log Collection
NetEye SIEM becomes the primary tool used to detect, analyze, respond to and prevent cyber security incidents. It also meets compliance requirements by centralizing logs and enabling forensic analysis.
NetEye SIEM aggregates event and flow data produced by connected resources (network devices servers, applications, etc.), normalizes them into a consistent format and correlates them by applying certain rules, allowing the analysis of events from different systems.
The platform natively supports the collection of events and flows from the network systems of the main vendors, but no limit is placed on the type of resources that can be integrated as Würth IT Italy Cyber Security Analysts can create customized filters capable of integrating any type of data.
The communication between the sources and NetEye SIEM can take place, at high level, in 2 modes:
pushing: the source sends data to NetEye SIEM, mainly through Elastic agent and the syslog protocol;
polling: NetEye SIEM connects to the source and collects its data; different protocols are used depending on the log source.
The log collection process supports the flexible use of TCP or UDP ports.
The solution ensures the collection and retention of logs and events generated in the customer’s IT environment, according to specific retention policies that can be configured on the platform, depending on the type of log and the organization’s need for compliance with certifications and accreditations.
The default log retention policy configured on the platform is 30 days for network devices and 180 days for servers. Elastic Stack (ELK), in its Enterprise version is the tool we use within NetEye SIEM to detect, analyze, respond to and prevent computer security incidents. ELK is valued for its speed, scalability, and ability to index different types of data. The data ingestion phase is the process by which raw data is analyzed, normalized and enriched before it is indexed. Once indexed, our Cyber Security Analysts can produce quite complex queries and initiate in-depth investigations.
An index in ELK is a set of data that is related to each other. ELK stores data in JSON format. During the indexing process, ELK stores data and builds an inverse index so that the data can be investigated in real time.
Logstash is one of ELK’s main applications and is used to aggregate, process, and transmit data to Elasticsearch.
Logstash allows us to receive data from different sources simultaneously, enrich and transform them before indexing them in Elasticsearch.
The way logs are collected and stored is fully compliant with GDPR and PCI-DSS regulations and ensures that the data is usable for forensic purposes, as it ensures that:
Logs are collected in real time. The solution performs time zone normalization and when components are located in countries with different time zones it is possible to configure them to use the same time zone as NetEye SIEM, or have all components adopt GMT (Greenwich Mean Time).
Logs cannot be altered. This is guaranteed by NetEye’s El Proxy module, which is based on blockchain technology (Log Management - Real Time Log Signing). Archived events and flows cannot be modified even by system administrators, but possibly deleted (any deletion operation is saved in the platform audit logs).
The logs are timestamped.
Agents
Below is the list of agents that will need to be installed on the hosts defined within the perimeter and their compatibility matrices.
Elastic Agent
Elastic Agent is installed with the relevant integrations, depending on the role of the host on which the installation takes place.
This agent is used to collect events and send them to the SIEM. Here you can view the compatibility matrix of the Elastic Agent.
Install on: all Microsoft Windows and Linux servers.
Icinga Agent
Icinga Agent is used to monitor the situation at the operational level of the various hosts and to send any active commands to the hosts.
Here you can view the compatibility matrix of the Icinga Agent.
Install on: all Microsoft Windows and Linux servers.
Sysmon
This official Microsoft component is installed on Windows servers and makes it possible to significantly improve the generation of events at the operating system level, making it possible to implement valid detection logics even in the event of bypassing the EDR solution that may be in use.
Events are then collected by the Elastic Agent and sent to the SIEM.
Install on: all Microsoft Windows and Linux servers.
sFlow / Netflow
If flow collection (sFlow / Netflow) is also envisaged in the project, an NBOX hardware probe is also installed within the customer’s infrastructure, with the objective of collecting sFlow/NetFlow flows generated by network devices compatible with these protocols, or (not necessarily alternatively) to collect the mirrored traffic from a series of source network interfaces.
The technology used in this context is that of NTOP, which incorporates a series of behavioral checks capable of identifying a large number of attacks such as exfiltration scenarios through DNS or ICMP tunnelling, ARP Poisoning, DHCP Starvation, SQL Injection, Cross Site Scripting and many others.
Behavioral checks, when triggered by the collected traffic, generate alerts that are sent to the NetEye SIEM, on which the corresponding detection rules are active. This can then lead the SOC analyst, if necessary, to open a ticket to the client.
Detection Rules and Use Cases
NetEye SIEM examines and correlates information in search of anomalies using detection rules.
When a detection rule is triggered by an event, NetEye SIEM generates an alarm, and each alarm can provide notification actions.
The NetEye SIEM solution comes with a large number of correlation rules available within the Elastic Detection Rules project:
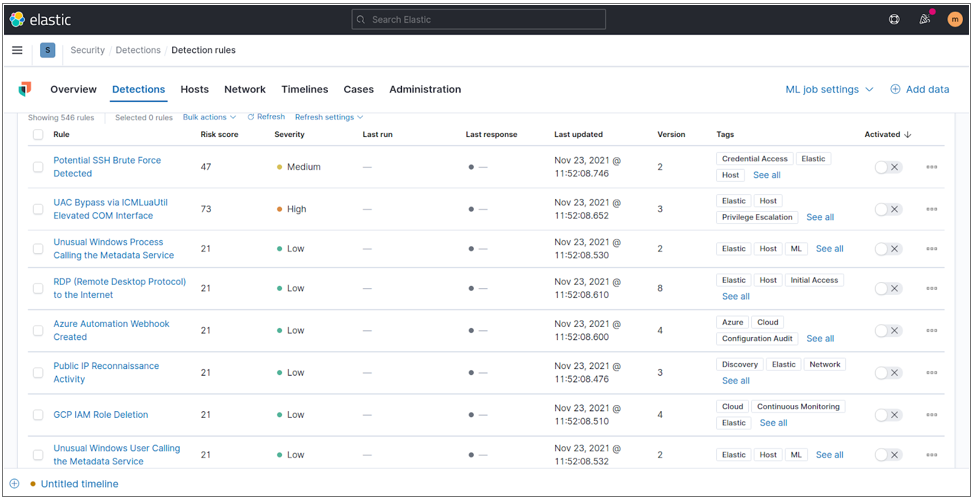
Fig. 225 Elastic detection rules.
The detection rules available are capable of analyzing a considerable number of event types. The following are some of them:
Rule |
How it works |
|---|---|
Anomaly |
analyses logs and netflows to identify new or unknown traffic, such as traffic suddenly ceasing, significantly different object access timestamps, completely different average traffic volumes. For example, the average traffic volume of the last 5 minutes can be compared with the average traffic volume of the last hour. If the variation is above a certain threshold, the rule generates an alarm. |
Authentication |
events related to authentication, session and access controls that monitor users on the network. |
Botnet: events generated by devices connected to the Internet that are infected with malware and controlled by a cyber criminal. |
|
Cloud |
events related to possible breaches on different cloud environments (e.g. Microsoft Office 365). |
Compliance |
rules geared towards identifying violations of compliance with applicable regulations (GDPR, PCI-DSS…). |
Cryptocurrency mining |
detect cryptocurrency mining activities. |
DDoS |
detecting activities that could lead to Distributed Denial of Services. |
they detect malicious activities carried out using the email communication channel, e.g. sending files containing sensitive data outside an organization. |
|
Exfiltration |
focus on detecting data exfiltration activities. |
Exploit |
they detect activities to exploit vulnerabilities in systems. |
Horizontal & Vertical movement |
they detect lateral and vertical movement related to attacks in progress. |
Intrusion detection |
they detect intrusions into systems. |
Malware |
events related to ransomware, viruses, Trojans, backdoors, rootkits or other forms of malicious software. |
Post-exploitation activity |
rules indicating possible attack activity in systems, generated following a successful intrusion. |
Ransomware |
Rules indicating possible intruder activity in systems, generated following a successful attack. |
System timing threshold |
rules indicating failure to receive logs from one or more sources after a given threshold. |
Threat Intelligence |
exclusive list (SATAYO IoC) of malicious ips/hostnames/domains. |
User Behavior Analytics (UBA) |
detects abnormal or malicious behavior. This Machine Learning feature creates a baseline of normal user activity and detects risky behavior. UBA highlights deviations in user behavior and shows who is doing what on the network. |
Threshold |
Analyses logs and netflows to identify activity that exceeds or falls below a certain threshold or has values outside a specified range. For example, a Threshold rule can be created specifying that no more than a specified number of clients can access a given service within business hours. The rule generates an alarm when a number of clients above the threshold attempt to gain access. |
The detection rules within NetEye SIEM are constantly updated thanks to a process that daily downloads the rules published on the GitHub Elastic Rules project.
Sigma Rules
Another important repository of detection rules used by the SOC is that of the Sigma Rules project, to which international researchers contribute in order to pool detection expertise.
The SOC of Würth IT Italy has developed the Sigma Crawler project, which receives all the rules of the Sigma Rules project as input on a daily basis and converts them into the Elastic compatible format.
This allows thousands of other rules to be available ready for use within the SIEM.
SOC Prime
In addition to the detection rules available within the Elastic Rule and Sigma Rule project, extensive use is made of the SOC Prime platform, which provides thousands of constantly updated detection rules.
The rules are sent from SOC Prime to NetEye SIEM and then only the detection rules related to the technology catalogue built on the basis of the active products and services within the Monitoring Perimeter of the individual customer are activated on the spaces of the various customers.
The list of detection rules activated within NetEye SIEM is constantly compared to the Attack Tactics, Techniques and Procedures surveyed within the Mitre Att&ck project, in order to verify and guarantee coverage of known threats.
Threat Intelligence correlation rules are based on the SATAYO IoC feed, which is updated daily.
The Cyber Security Analysts team is able to write any new detection rules customized to the organization’s specific needs. The detection rules allow the construction of use cases, malicious scenarios that need to be identified. Part of the team of the Attacker Centric SOC is daily focused on Threat Hunting activities. This makes it possible to continuously obtain knowledge on the Attack Techniques, Tactics and Procedures used by threat actors and to build useful Use Cases accordingly.
The definition of Use Cases and Detection Rules constitutes one of the most important and delicate phases of the SIEM implementation process and will be an important part of the onboarding phase of the service.
To obtain the greatest possible visibility of the infrastructure, it is important to connect as many sources as possible to the SIEM. Depending on the types of sources connected, in fact, different types of attacks may be identified.
To be sure that all sources are always sending logs and events NetEye SIEM uses monitoring checks that send alarms if any source does not send events to the SIEM for a given time window.
Enrichment
Another key feature of NetEye SIEM is the possibility to enrich the collected data with contextual information, e.g. geolocation data, business criticality, details of assets and infrastructure in general.
Geographic data in NetEye SIEM is used to visually display IP addresses within a map and can be used in rules to create specific alarms based on the geographic location of hosts. The geographic location information is obtained either from a geographic search database provided by MaxMind.
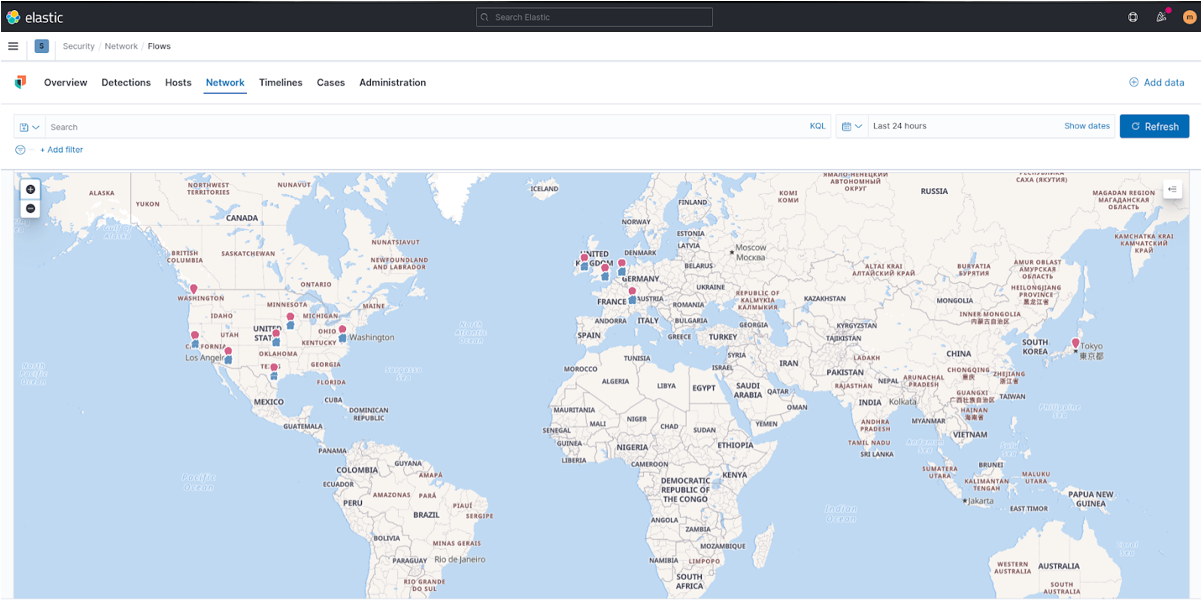
Fig. 226 Geographic location of IP addresses.
The data collected is supplemented with information about the assets and the role they play within the customer’s business (impact).
The metrics established by FIPS199 (page 10) are used to assess impact. Each host sending events within the SIEM will then be given the impact property (Low, Moderate, High).
The NetEye SIEM platform is integrated with the SATAYO IoC feed. By integrating the IoCs, which are updated daily and contain information on IPs, hostnames, suspicious or dangerous domains, the Cyber Security Analysts team has sufficient contextual information to immediately identify alerts that need to be promptly investigated or directly assigned to the Incident Response (IR) team.
Finally, the SIEM uses the vulnerability information to determine the level of severity and possible business impact of detected threats.
NetEye SIEM is integrated with the Continuous Vulnerability Assessment platform Greenbone Security Manager. If the customer has a different platform, its integration can be considered.
Dashboard and Report
This section describes the data visualization and reporting functionalities of NetEye SIEM.
The customer’s designated employees will have access to the platform via an authenticated https web interface, with read-only permissions. The platform can be accessed using a common browser and there are no limitations in the number of users that can simultaneously access the tool.
Access will be given to several dashboards, which will contain the information of interest monitored by the Cyber Security Analysts.
The dashboards make you aware of the normal behavior of users, applications and devices and allow you to detect any anomalies that may indicate threats to the organization’s cyber security.
Dashboards allow you to drill down into the relevant section to the desired level in order to gain access to detailed information and be able to investigate certain logs. A number of default dashboards have been developed to cater for different visualization needs, and the Cyber Security Analysts team is available to customize dashboards for specific customer requirements.
From the various configured dashboards, reports in pdf format can be generated and shared.
The following is an example of a view of the dashboards that are made available to the customer by default:
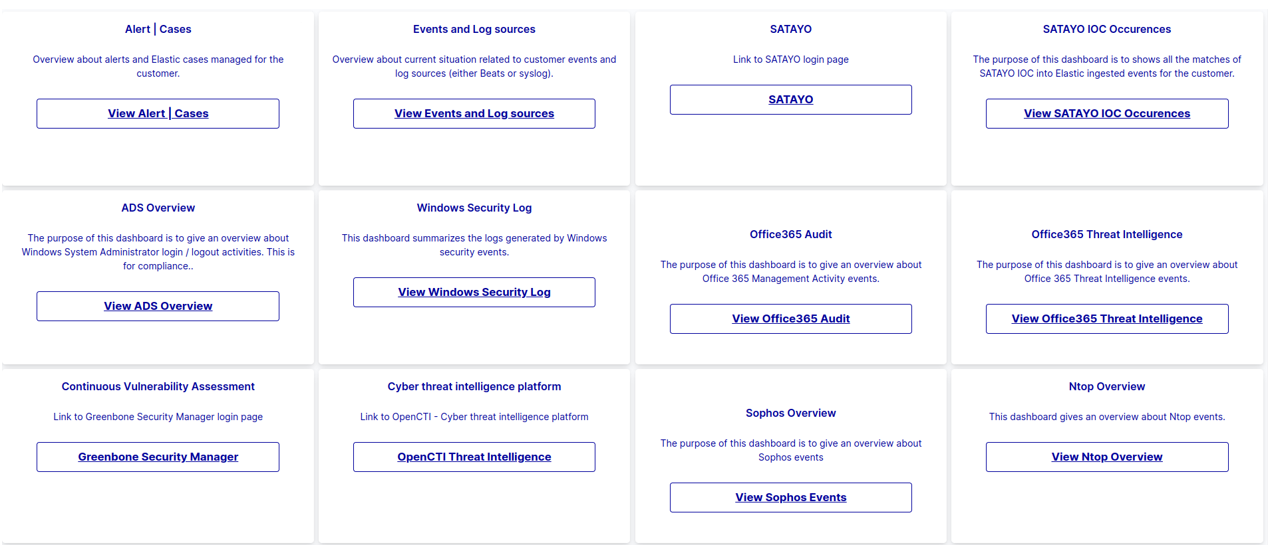
Fig. 227 Default Dashboard view.
The list of reports and their periodicity of generation is given below:
Report title |
Description |
Periodicity |
|---|---|---|
SOC report |
In this report you will find all information about the status of your company over the past month. Included are all the operations performed by our SOC, such as alerts and tickets handled. In addition, there will be a focus on cybercriminals with a list of ransomware attacks carried out this month, a list of new zero-day vulnerabilities, general vulnerability trends, security bulletins and much more. |
Monthly |
SOC ADS report |
This report contains all information on the activity of system administrators. The number of logins, logouts and failed logins is monitored, as well as the machines used by the administrators. Please note that for a more complete and in-depth view, Elastic is always available. |
Monthly |
Red Team report |
In this report you will find information on the attack simulation that is carried out at the end of the onboarding phase. |
Una tantum |
VA report |
In this report you will find all the information about the status of your company over the last month, regarding any vulnerability identified on the public perimeter that has been shared. |
Monthly |
Weekly report - Malicious IP |
This report contains information and statistics on the connection between internal IP addresses (subnets 10.0.0/8 or 172.16.0/12 or 192.168.0/16) and external IPs on one or more blacklists. Communications prevented, dropped, denied and rejected by the firewall are excluded. |
Weekly |
Informative report |
This report contains information and statistics on the connection between internal IP addresses (subnets 10.0.0/8 or 172.16.0/12 or 192.168.0/16) and external IPs on one or more blacklists. Communications prevented, dropped, denied and rejected by the firewall are excluded. |
Not Defined |
SLA report |
This report contains the Service Level Agreement values found during the reporting period. |
Monthly |
XDR
Elastic Endpoint Security, powered by the Elastic Stack, is a comprehensive endpoint protection, detection, and response (EPP/EDR) solution designed to safeguard diverse endpoints (laptops, servers, VMs, containers) across hybrid environments.
Key Technical Features:
Behavioral AI & Machine Learning: Employs advanced machine learning models and behavioral analytics to detect and prevent unknown threats like ransomware, malware, and fileless attacks. This includes identifying anomalous activities, deviations from normal user/entity behavior, and sophisticated attack techniques.
Signatureless Prevention: Moves beyond traditional signature-based detection, focusing on the actions and behaviors of threats to proactively block malicious activity pre- and post-execution.
XDR Capabilities: Extends beyond the endpoint to collect and correlate telemetry data from various security tools and data sources (logs, network traffic, cloud services) for unified visibility and contextualized threat detection. This enables faster identification of complex attack patterns.
MITRE ATT&CK Alignment: Aligns detections and provides visibility into adversary tactics and techniques mapped to the MITRE ATT&CK framework, enabling security teams to understand and respond to threats effectively.
Unified Agent: Utilizes a single, lightweight agent (Elastic Defend) for data collection, threat prevention, detection, and response across all protected endpoints, simplifying deployment and management.
Centralized Visibility & Management (Kibana): Provides a centralized console within Kibana for real-time monitoring, visualization, and analysis of security events. This includes dashboards for threat identification, incident triage, and case management.
Automated Response Actions: Offers automated response capabilities to neutralize threats, such as killing processes, suspending threads, isolating hosts, and quarantining malicious files. Integrates with SOAR platforms for broader playbook execution.
Threat Hunting & Investigation: Facilitates proactive threat hunting by enabling analysts to search across petabytes of historical and real-time data, correlating host activity with broader environmental data to uncover hidden threats and anomalies.
Scalability & Performance: Built on the highly scalable and performant Elasticsearch platform, allowing for ingestion, storage, and analysis of massive volumes of security data at speed.
Flexible Deployment: Supports various deployment models, including cloud, on-premises, and hybrid environments.