User Guide Functional Overview Requirements Architecture System Installation NetEye Additional Components Installation Setup The neteye Command Director NetEye Self Monitoring Tornado Business Service Monitoring IT Operation Analytics - Telemetry Geo Maps NagVis Audit Log Shutdown Manager Reporting ntopng Visual Monitoring with Alyvix Elastic Stack IT Operations (Command Orchestrator) Asset Management Service Level Management Cyber Threat Intelligence - SATAYO NetEye.Cloud Strategy Monitoring SOC System Administrator SOC Attacker Centric NetEye Update & Upgrade Backup and Restore How To NetEye Extension Packs Troubleshooting Security Policy Glossary
module icon Monitoring
Monitoring with NetEye.Cloud Monitoring Environment Business Service Monitoring VMD
NetEye.Cloud Strategy Monitoring SOC System Administrator SOC Attacker Centric Introduction to NetEye Monitoring Business Service Monitoring IT Operation Analytics Visualization Network Visibility Log Management & Security Orchestrated Datacenter Shutdown Application Performance Monitoring User Experience Service Management Service Level Management & Reporting Requirements for a Node Cluster Requirements and Best Practices NetEye Satellite Requirements TCP and UDP Ports Requirements Additional Software Installation Introduction Single Node Cluster NetEye Master Master-Satellite Architecture Underlying Operating System Acquiring NetEye ISO Image Installing ISO Image Single Nodes and Satellites Cluster Nodes Configuration of Tenants Satellite Nodes Only Nodes behind a Proxy Additional NetEye Components Single Node Cluster Node Satellites Nodes only Verify if a module is running correctly Accessing the New Module Cluster Satellite Security Backup and Restore Identity and Access Management External Identity Providers Configure federated LDAP/AD Emergency Reset of Keycloak Configuration Advanced Configuration Roles Single Page Application in NetEye Module Permissions and Single Sign On Within NetEye Importing User Federation Groups inside another Group Importing OIDC IdP Groups inside another Group Resources Tuning Advanced Topics Basic Concepts & Usage Advanced Topics Monitoring Environment Templates Monitored Objects Import Monitored Objects Data Fields Deployment Icinga 2 Agents Configuration Baskets Dashboard Monitoring Status Icinga2 Features VMD Permissions Notifications Jobs API Configuring Icinga Monitoring Retention Policy NetEye Self Monitoring Concepts Collecting Events Add a Filter Node WHERE Conditions Iterating over Event fields Retrieving Payload of an Event Extract Variables Create a Rule Tornado Actions Test your Configuration Export and Import Configuration Example Under the hood Development Retry Strategy Configuration Thread Pool Configuration API Reference Configure a new Business Process Create your first Business Process Node Importing Processes Operators The ITOA Module Configuring User Permissions Telegraf Metrics in NetEye Telegraf Configuration Telegraf on Monitored Hosts Visualizing Dashboards Customizing Performance Graph The NetEye Geo Map Visualizer Map Viewer Configuring Geo Maps NagVis Audit Log Overview Shutdown Manager user Shutdown Manager GUI Shutdown Commands Advanced Topics Overview User Role Management Cube Use Cases ntopng and NetEye Integration Permissions Retention Advanced Topics Overview User Roles Nodes RDP Client Building Tools Editor: Interface Overview Editor: Script Building Editor: Managing Scripts Designer: Interface Overview Designer: Interface Options Designer: Component Tree Selector: Interface Overview Test Case Management Dashboard Use Cases Overview Architecture Authorization Kibana Elasticsearch Cluster Elasticsearch Configuration Replicas on a Single Node Elasticsearch Performance tuning Overview Enabling El Proxy Sending custom logs to El Proxy Configuration files Commands Elasticsearch Templates and Retentions El Proxy DLQ Blockchain Verification Handling Blockchain Corruptions El Proxy Metrics El Proxy Security El Proxy REST Endpoints Agents Logstash Elastic APM Elastic RUM Elastic XDR Log Manager - Deprecated Overview Authorization in the Command Orchestrator Module Configuring CLI Commands Executing Commands Overview Permissions Installation Single Tenancy Multitenancy Communication through a Satellite Asset collection methods Display asset information in monitoring host page Overview Customers Availability Event Adjustment Outages Resource Advanced Topics Introduction Getting Started SATAYO Items Settings Managed Service Mitre Attack Coverage Changelog NetEye.Cloud as a SaaS solution Monitoring with NetEye.Cloud Monitoring Environment Business Service Monitoring VMD SOC System Administrator (AdS) Access to NetEye and Elastic Elastic Dashboards Elastic Discover Elastic Alerts Elastic Rules Introduction to SOC Attacker Centric Service Description NetEye SIEM Before you start Update Procedure Single Node Upgrade from 4.45 to 4.46 Cluster Upgrade from 4.45 to 4.46 Satellite Upgrade from 4.45 to 4.46 DPO machine Upgrade from 4.45 to 4.46 Create a mirror of the RPM repository Sprint Releases Feature Troubleshooting Backup and Restore Tornado Networking Service Management - Incident Response IT Operation Analytics - Telemetry Identity Provider (IdP) Configuration NetEye Cluster on Microsoft Azure Introduction to NEP Getting Started with NEPs Online Resources Obtaining NEP Insights Available Packages Advanced Topics Upgrade to NetEye 4.31 Setup Configure swappiness Restarting Stopped Services Enable stack traces in web UI How to access standard logs Director does not deploy when services assigned to a host have the same name How to enable/disable debug logging Activate Debug Logging for Tornado Modules/Services do not start Sync Rule fails when trying to recreate Icinga object How to disable InfluxDB query logging Managing an Elasticsearch Cluster with a Full Disk Some logs are not indexed in Elasticsearch Elasticsearch is not functioning properly Reporting: Error when opening a report Debugging Logstash file input filter Bugfix Policy Reporting Vulnerabilities Glossary

Monitoring Environment

NetEye builds around Icinga, a monitoring system which checks the availability of your network resources, notifies users of outages, and generates performance data for reporting.

Icinga 2 is the monitoring server and relies on Icinga Web 2.

The monitoring environment is organized according to Roles and Zones. A distributed monitoring environment includes high-availability clustering and setup details for Icinga masters, satellites and agents. Check out official Icinga 2 documentation for details.

Hosts and Services

With the NetEye.Cloud Monitoring service you can monitor the availability of hosts and services. Hosts and services can be virtually anything which can be checked in some way, e,g, Network services (HTTP, SMTP, SNMP, SSH, etc.), printers, switches or routers, temperature sensors and other local or network-accessible services.

Host objects provide a mechanism to group services that are running on the same physical device.

Host and Service states help to indicate if an object is available, working properly or experiencing any issues. A full range of states is available in the official Icinga2 documentation.

Hosts and services determine their state by running checks in a regular interval, some of them are built-in, e.g. hostalive. Check out a full list of check commands in the official documentation.

Monitoring Status

As the check commands run, you will be able to check out Monitoring status of the objects.

The monitoring Overview is presented in monitoring panels, allowing you to check out the status or have a closer look at all the details of the check result.

You can sort the results by Host or Services, or even see the aggregated stats for the host or service groups, and even check comments or the status of a scheduled downtime.

The Monitoring panels in NetEye are divided into several sections, each carrying different information.

  • Plugin Output

  • Performance Graph

  • Notifications

  • Check execution

../../_images/monitoring-status.png

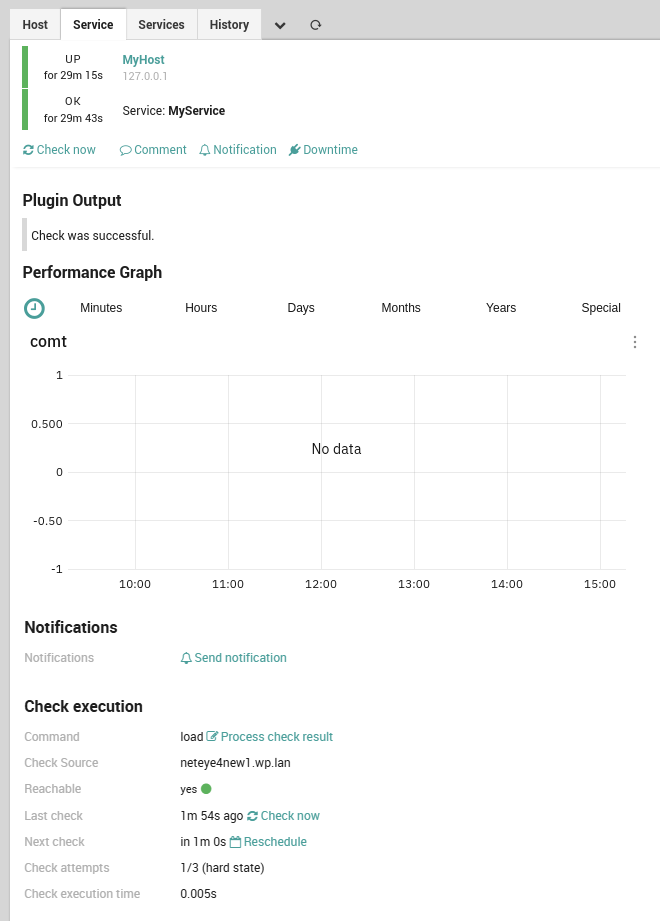
Fig. 209 The Monitoring status.

When finding your hosts in the Overview, choosing a specific host would open services view of the host, allowing to see all the services with status associated with it.