VMD
To easily and reliably check the status of a Monitored Object it is fundamental to find all its Monitoring information in a single point. The VMD module integrates the information related to your Virtualization infrastructure next to each Host in the Monitoring.
vSphereDB Monitoring Integration is available by default for all NetEye.Cloud Monitoring Service subscribers.
During the onboarding process, you will provide the necessary information and parameters related to your environment (such as vCenter details, Monitoring backend identifiers like IDO Resource and Source Type). Based on this the mapping of each monitored host to a corresponding VMD Object — host or virtual machine will be created.
As the mapping has been performed, you will be able to see a section in the status page of those Monitored Host mapped with a VMD Object.
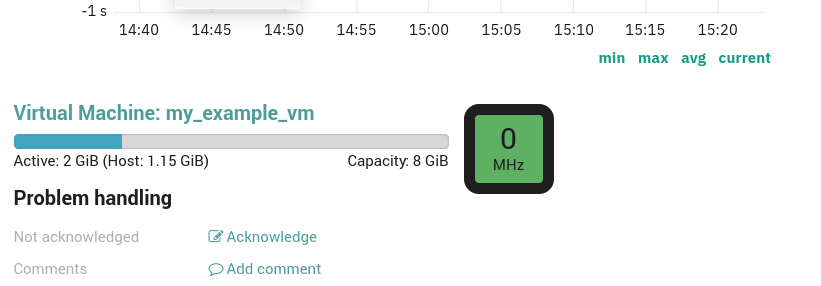
Fig. 211 vSphereDB Monitoring Integration Section.
vSphereDB Dashboards
The NetEye VMD installs out-of-the-box dashboards in The ITOA Module, which give you easy access to both an overview and detailed information of your virtualization infrastructure.
In particular, the dashboards are available in the Main Org. Grafana Organization
under the folder neteye-vspheredb-graphs and include the following dashboards:
Top VMs: shows which Virtual Machines are responsible for the most traffic on their Virtual Interfaces in the given time period
Virtual Machine Details: gives you insights on the System-level performance of each Virtual Machine