Functional Overview
Requirements
Architecture
System Installation
NetEye Additional Components Installation
Setup
The neteye Command
Director
NetEye Self Monitoring
Tornado
Business Service Monitoring
IT Operation Analytics - Telemetry
Geo Maps
NagVis
Audit Log
Shutdown Manager
Reporting
ntopng
Visual Monitoring with Alyvix
Elastic Stack
IT Operations (Command Orchestrator)
Asset Management
Service Level Management
Cyber Threat Intelligence - SATAYO
NetEye.Cloud Strategy
Monitoring
SOC System Administrator
SOC Attacker Centric
NetEye Update & Upgrade
Backup and Restore
How To
NetEye Extension Packs
Troubleshooting
Security Policy
Glossary
SOC System Administrator
SOC System Administrator (AdS)
Access to NetEye and Elastic
Elastic Dashboards
Elastic Discover
Elastic Alerts
Elastic Rules
NetEye.Cloud Strategy
Monitoring
SOC System Administrator
SOC Attacker Centric
Introduction to NetEye
Monitoring
Business Service Monitoring
IT Operation Analytics
Visualization
Network Visibility
Log Management & Security
Orchestrated Datacenter Shutdown
Application Performance Monitoring
User Experience
Service Management
Service Level Management & Reporting
Requirements for a Node
Cluster Requirements and Best Practices
NetEye Satellite Requirements
TCP and UDP Ports Requirements
Additional Software Installation
Introduction
Single Node
Cluster
NetEye Master
Master-Satellite Architecture
Underlying Operating System
Acquiring NetEye ISO Image
Installing ISO Image
Single Nodes and Satellites
Cluster Nodes
Configuration of Tenants
Satellite Nodes Only
Nodes behind a Proxy
Additional NetEye Components
Single Node
Cluster Node
Satellites Nodes only
Verify if a module is running correctly
Accessing the New Module
Cluster
Satellite
Security
Backup and Restore
Identity and Access Management
External Identity Providers
Configure federated LDAP/AD
Emergency Reset of Keycloak Configuration
Advanced Configuration
Roles
Single Page Application in NetEye
Module Permissions and Single Sign On Within NetEye
Importing User Federation Groups inside another Group
Importing OIDC IdP Groups inside another Group
Resources Tuning
Advanced Topics
Basic Concepts & Usage
Advanced Topics
Monitoring Environment
Templates
Monitored Objects
Import Monitored Objects
Data Fields
Deployment
Icinga 2 Agents
Configuration Baskets
Dashboard
Monitoring Status
Icinga2 Features
VMD
Permissions
Notifications
Jobs
API
Configuring Icinga Monitoring Retention Policy
NetEye Self Monitoring
Concepts
Collecting Events
Add a Filter Node
WHERE Conditions
Iterating over Event fields
Retrieving Payload of an Event
Extract Variables
Create a Rule
Tornado Actions
Test your Configuration
Export and Import
Configuration Example
Under the hood
Development
Retry Strategy Configuration
Thread Pool Configuration
API Reference
Configure a new Business Process
Create your first Business Process Node
Importing Processes
Operators
The ITOA Module
Configuring User Permissions
Telegraf Metrics in NetEye
Telegraf Configuration
Telegraf on Monitored Hosts
Visualizing Dashboards
Customizing Performance Graph
The NetEye Geo Map Visualizer
Map Viewer
Configuring Geo Maps
NagVis
Audit Log
Overview
Shutdown Manager user
Shutdown Manager GUI
Shutdown Commands
Advanced Topics
Overview
User Role Management
Cube
Use Cases
ntopng and NetEye Integration
Permissions
Retention
Advanced Topics
Overview
User Roles
Nodes
RDP Client
Building Tools
Editor: Interface Overview
Editor: Script Building
Editor: Managing Scripts
Designer: Interface Overview
Designer: Interface Options
Designer: Component Tree
Selector: Interface Overview
Test Case Management
Dashboard
Use Cases
Overview
Architecture
Authorization
Kibana
Elasticsearch Cluster
Elasticsearch Configuration
Replicas on a Single Node
Elasticsearch Performance tuning
Overview
Enabling El Proxy
Sending custom logs to El Proxy
Configuration files
Commands
Elasticsearch Templates and Retentions
El Proxy DLQ
Blockchain Verification
Handling Blockchain Corruptions
El Proxy Metrics
El Proxy Security
El Proxy REST Endpoints
Agents
Logstash
Elastic APM
Elastic RUM
Elastic XDR
Log Manager - Deprecated
Overview
Authorization in the Command Orchestrator Module
Configuring CLI Commands
Executing Commands
Overview
Permissions
Installation
Single Tenancy
Multitenancy
Communication through a Satellite
Asset collection methods
Display asset information in monitoring host page
Overview
Customers
Availability
Event Adjustment
Outages
Resource
Advanced Topics
Introduction
Getting Started
SATAYO Items
Settings
Managed Service
Mitre Attack Coverage
Changelog
NetEye.Cloud as a SaaS solution
Monitoring with NetEye.Cloud
Monitoring Environment
Business Service Monitoring
VMD
SOC System Administrator (AdS)
Access to NetEye and Elastic
Elastic Dashboards
Elastic Discover
Elastic Alerts
Elastic Rules
Introduction to SOC Attacker Centric
Service Description
NetEye SIEM
Before you start
Update Procedure
Single Node Upgrade from 4.45 to 4.46
Cluster Upgrade from 4.45 to 4.46
Satellite Upgrade from 4.45 to 4.46
DPO machine Upgrade from 4.45 to 4.46
Create a mirror of the RPM repository
Sprint Releases Feature
Troubleshooting
Backup and Restore
Tornado
Networking
Service Management - Incident Response
IT Operation Analytics - Telemetry
Identity Provider (IdP) Configuration
NetEye Cluster on Microsoft Azure
Introduction to NEP
Getting Started with NEPs
Online Resources
Obtaining NEP
Insights
Available Packages
Advanced Topics
Upgrade to NetEye 4.31
Setup
Configure swappiness
Restarting Stopped Services
Enable stack traces in web UI
How to access standard logs
Director does not deploy when services assigned to a host have the same name
How to enable/disable debug logging
Activate Debug Logging for Tornado
Modules/Services do not start
Sync Rule fails when trying to recreate Icinga object
How to disable InfluxDB query logging
Managing an Elasticsearch Cluster with a Full Disk
Some logs are not indexed in Elasticsearch
Elasticsearch is not functioning properly
Reporting: Error when opening a report
Debugging Logstash file input filter
Bugfix Policy
Reporting Vulnerabilities
Glossary
This section will explore how Elastic Alerts work and explain how to analyze them.
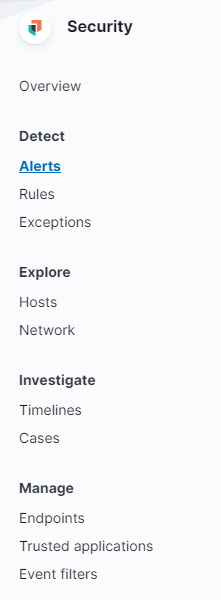
There are five active detection rules within Elastic that generate alerts if anomalies or suspicious
behavior are detected. We’ll see how to control these alerts here.
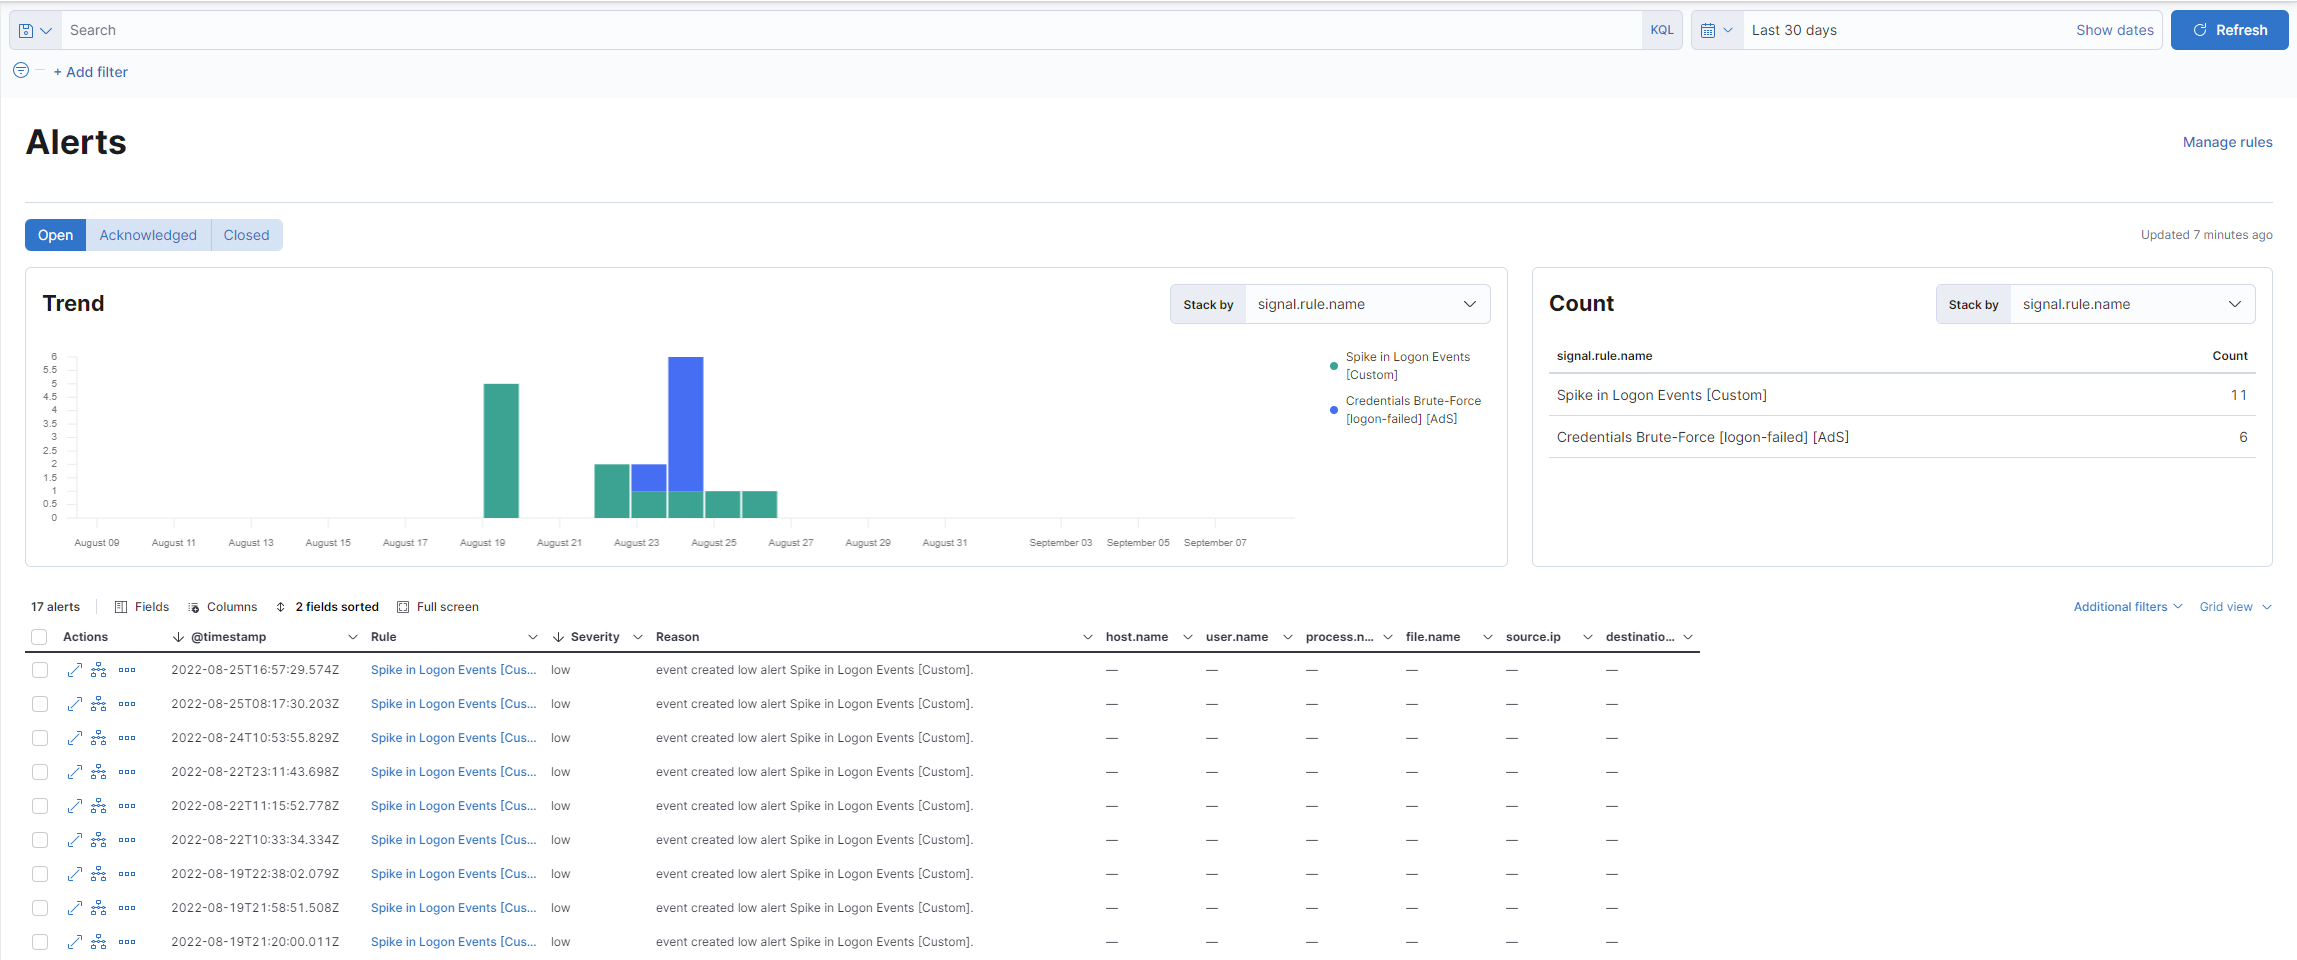
The interface contains a search bar and a time range at the top, three main sections called Open,
Acknowledged and Closed, a time graph, a summary table and one containing the details of the various alerts.
All triggered alerts have an open status and are displayed at the bottom along with the time
they were triggered, the rule that detected them, and other details. Each alert can be expanded
to view its entire contents, similar to how documents were expanded in Discover.
To analyze the event, what you usually do is open the Discover section in another window,
set the time range to when the alert was triggered and filter by host, user or event type (depending
on what you are looking for).
I want to check the alert associated with the Spike rule in Logon Events
Steps:
Open a Discover in another tab, so as not to lose the details of the alert section.
Make sure you’re using the correct index (winlogbeat).
Filter the period in which the alert occurred with the time range in the top right.
Note
The time displayed next to the alert does not indicate the exact event itself,
but rather when the rule reported it. It may therefore be necessary to analyze it
a little earlier than that time.
Filter for login events by typing a query of your choice between the two below:
- event.action : logged-in
- event.code : 4624
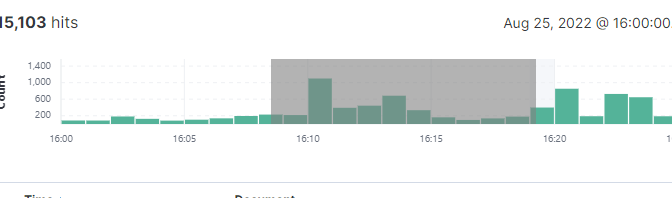
Look for the peak reported by the alert and once found you can narrow the time range to exclude irrelevant data.
Fig. 220 You can narrow the time period by dragging the cursor on the graph. A gray area will be highlighted, encompassing the results. You can also click directly on a peak.
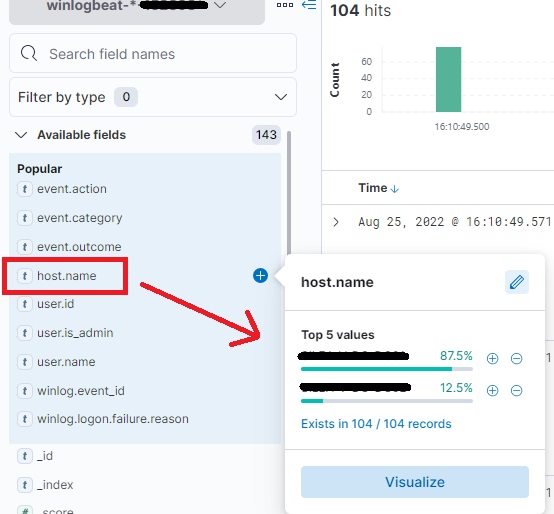
Check the host values in the documents to understand which machine is affected.
Fig. 221 You can click on one of the fields in the left column (not the + symbol) to get a percentage list of the values present within the documents.
Finally, you can check the user who logged in, try to understand the reason, and, if it’s due
to a misconfiguration, try to fix it. You can also check if similar behavior has occurred on the same machine in the past (extending the time frame).
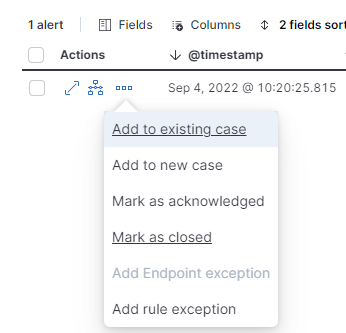
After reviewing an alert, I can change its status to Acknowledged or Closed.
This can be done by returning to the alert list and clicking on the three dots next to the alert in focus.
Note
Some alert management options, such as closing, may not be immediately available due to a read-only user permission issue.
These permissions will be updated to allow proper alert management.