Elastic Discover
In this section, we will explore how Elastic’s Discover feature works.
This section allows us to view all the logs present in Elastic. You can filter by date and field by writing appropriate queries. The syntax is simple and will be explained shortly. Saved and pre-compiled queries have also been prepared, which are easy to use and modify to help you better understand the syntax and how to find the information you need.
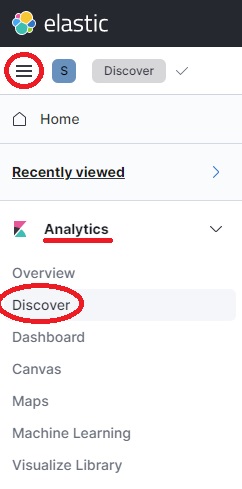
You can access Discover from the top-left menu, located under the Analytics category.
Once selected it will appear as shown in the image below:
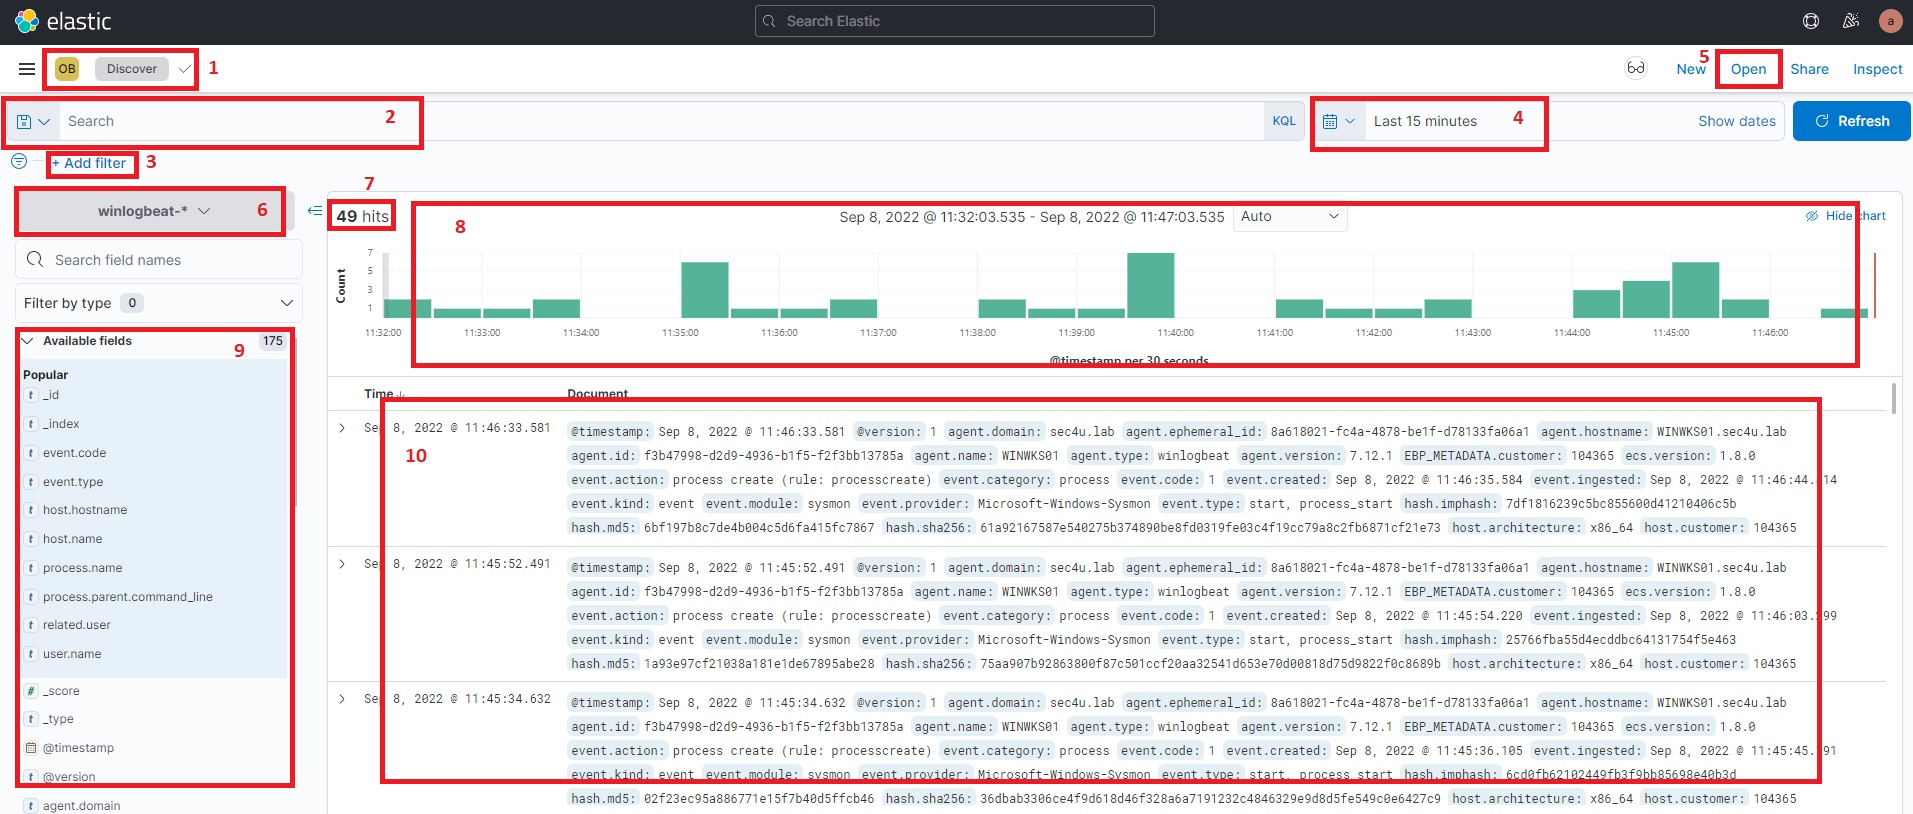
The name of your space and the section you are in
The search bar through which you can query and filter data
Additional filters that can be applied to the query or used individually to filter the data
The filter to select the time range in which the results will be shown
The ability to open previously saved search queries (these will be made available as examples)
The Elastic index where the data to be displayed is contained
The number of logs (also called documents) found within the chosen timerange and the query written
The chart of previous documents sorted by time
The fields of the documents found
The complete list of documents, sorted from newest to oldest. You can expand each individual document and view all the fields within it.
Use and research
It’s very important to select the correct index (point 6 in the previous image) to view the data we’re interested in. In the case of an SOC ADS, only authentication events are present in Elastic, and they can be found within the index winlogbeat.
The search bar comes to our aid, suggesting the available fields and the values to choose from.
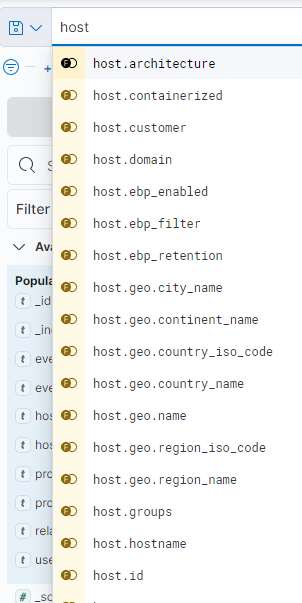
Fig. 214 By typing, the fields are suggested to the user.
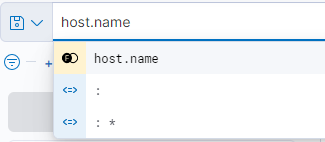
Fig. 215 The colon means equal to, the asterisk means any.
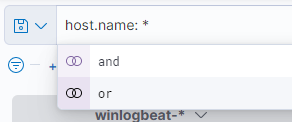
Fig. 216 Multiple fields can be correlated with AND and OR operations.
It is important to understand which are the most interesting fields and their possible values, in order to be able to use them later in queries.
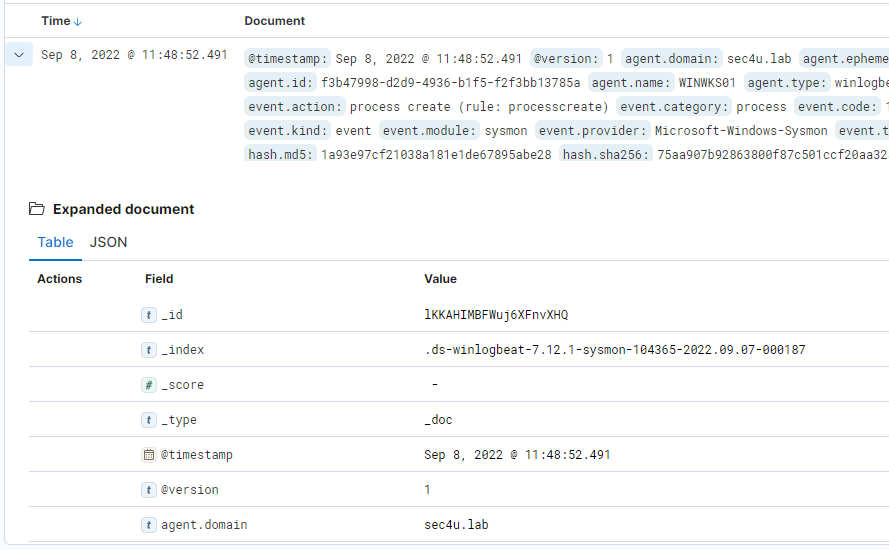
To view the various available fields and their values, we can expand a document by clicking the arrow to the left of the date. See figure.
From the left-hand column of fields, we can click and select values, which will then be added as columns in the detailed view on the right. This allows us to quickly check the contents of each document without having to expand it.
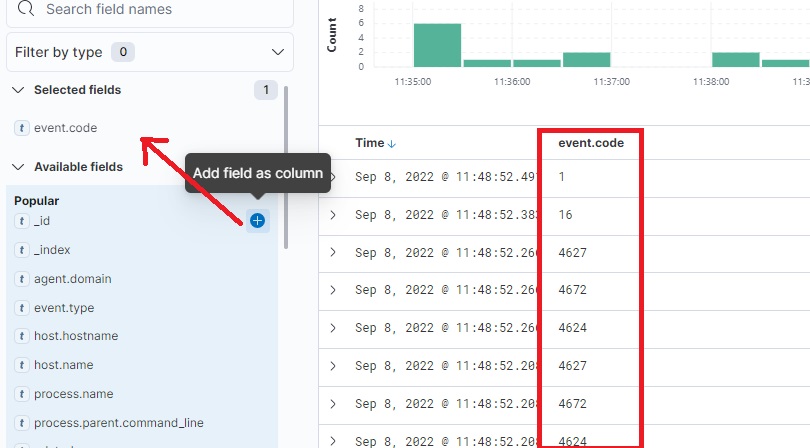
Each column can be sorted and moved as needed.
Query examples
The figure below shows an example query. The searched values will be highlighted in yellow in the results.
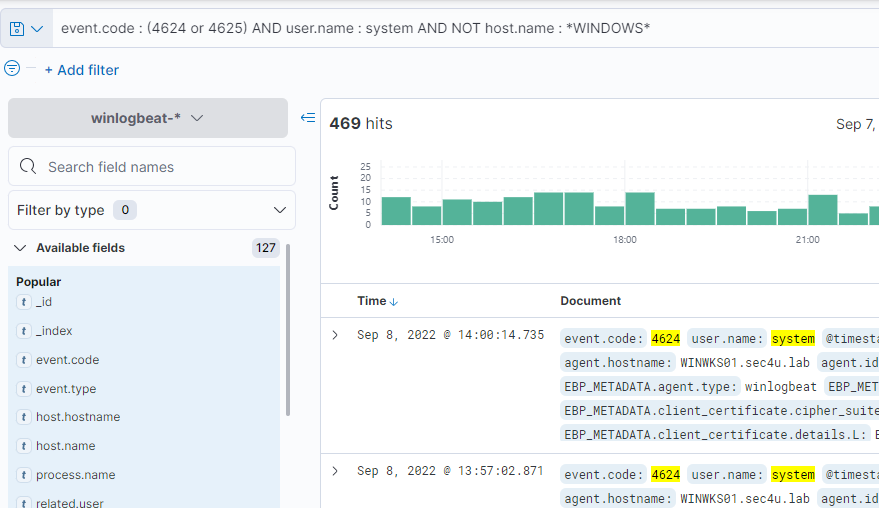
The AND, OR, and NOT parameters are not case-sensitive and can be written in either uppercase or lowercase.
There is a colon ( : ) between the field name and the value, but there is no need to insert spaces before and after.
The asterisk ( * ) can be added to both the field and the value and includes everything. For example, event.co* : 46*4 is a valid query.
Filter examples
Adding a filter is possible by selecting Add filter below the search bar. The interface also helps us by guiding us through the selection of the field, operator, and value.
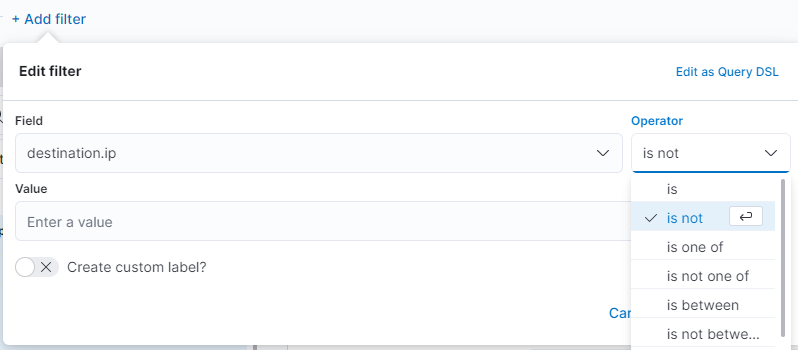
Fig. 217 Creating a filter manually
You can also filter values directly from the document by expanding it and clicking the + or - next to a value. The filter will be applied and visible at the top.
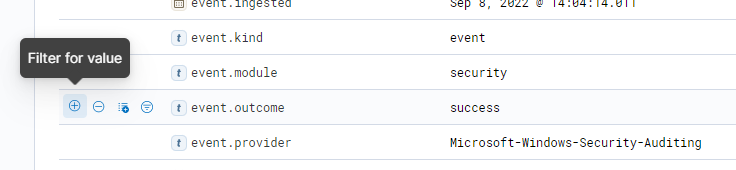
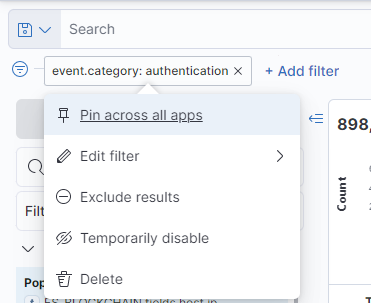
Once active, the filter remains visible at the top, under the search bar. From there you can edit it, reverse it, disable it, or remove it by simply clicking on it.
Accessing saved queries
In the top bar, above the timerange, there is the Open button, which allows you to access some queries created by us previously.
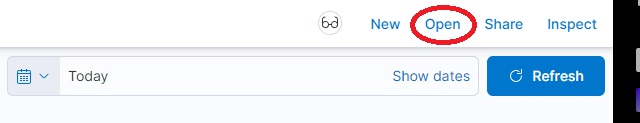
You are free to open them and use them as starting points to begin gaining some familiarity with the syntax.
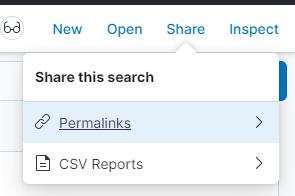
After writing a query (and optionally adding filters), you can export it as a link using the Share button. Adding that link to your favorites will allow you to access the query in the future.