Elastic Dashboards
In this section, we will explore how Elastic Dashboards work.
Your Elastic user has read-only access, so you’re free to explore the various features without the risk of making any incorrect changes.
After successfully logging in with the NetEye Cloud, you will land in a Welcome Tenant Dashboard.
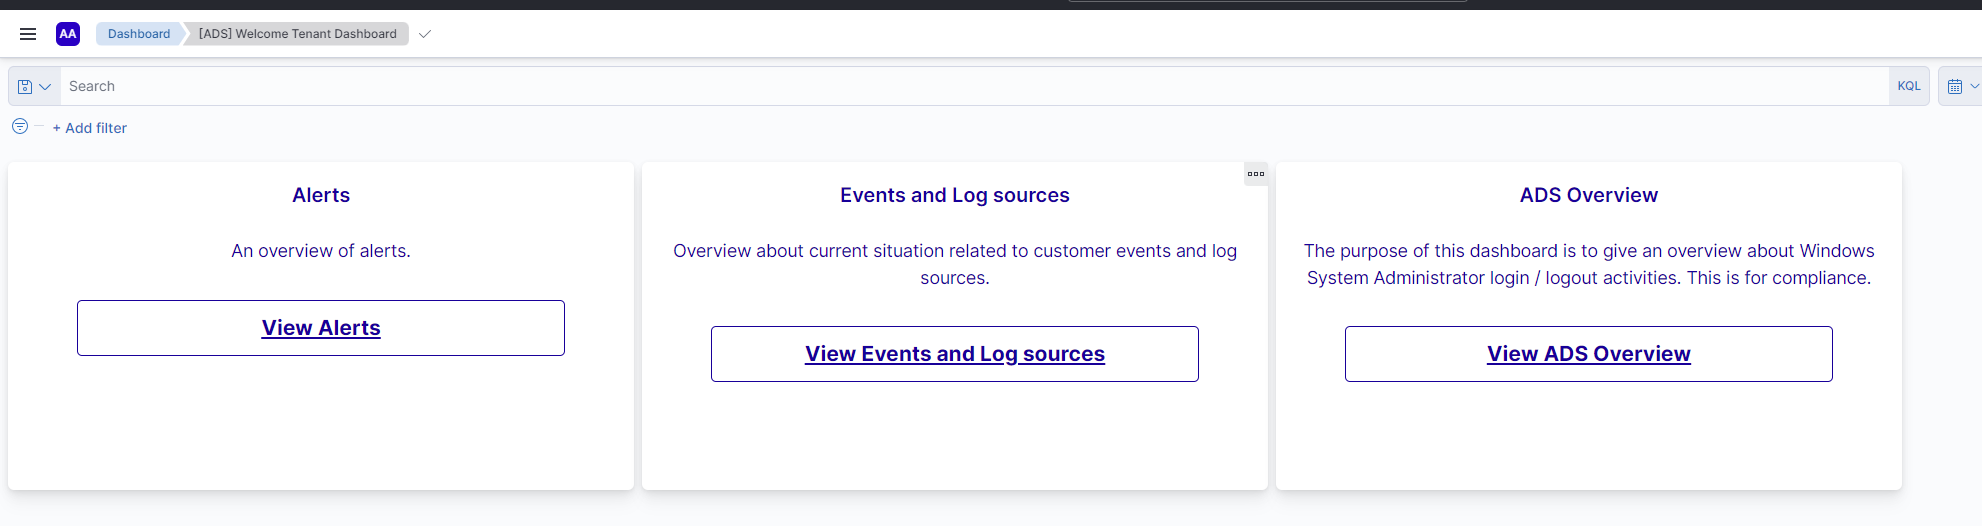
Fig. 213 Welcome Tenant Dashboard.
From here, you can explore three specific dashboards: Alerts, Events and Log sources and ADS Overview.
Alerts
The first dashboard contains details about the alerts triggered in the selected time period.
The graphs are dynamically populated and display information such as the total number of alerts, their severity, the date of occurrence, the type of Mitre Att&ck tactic associated with them, and the rule that triggered them.
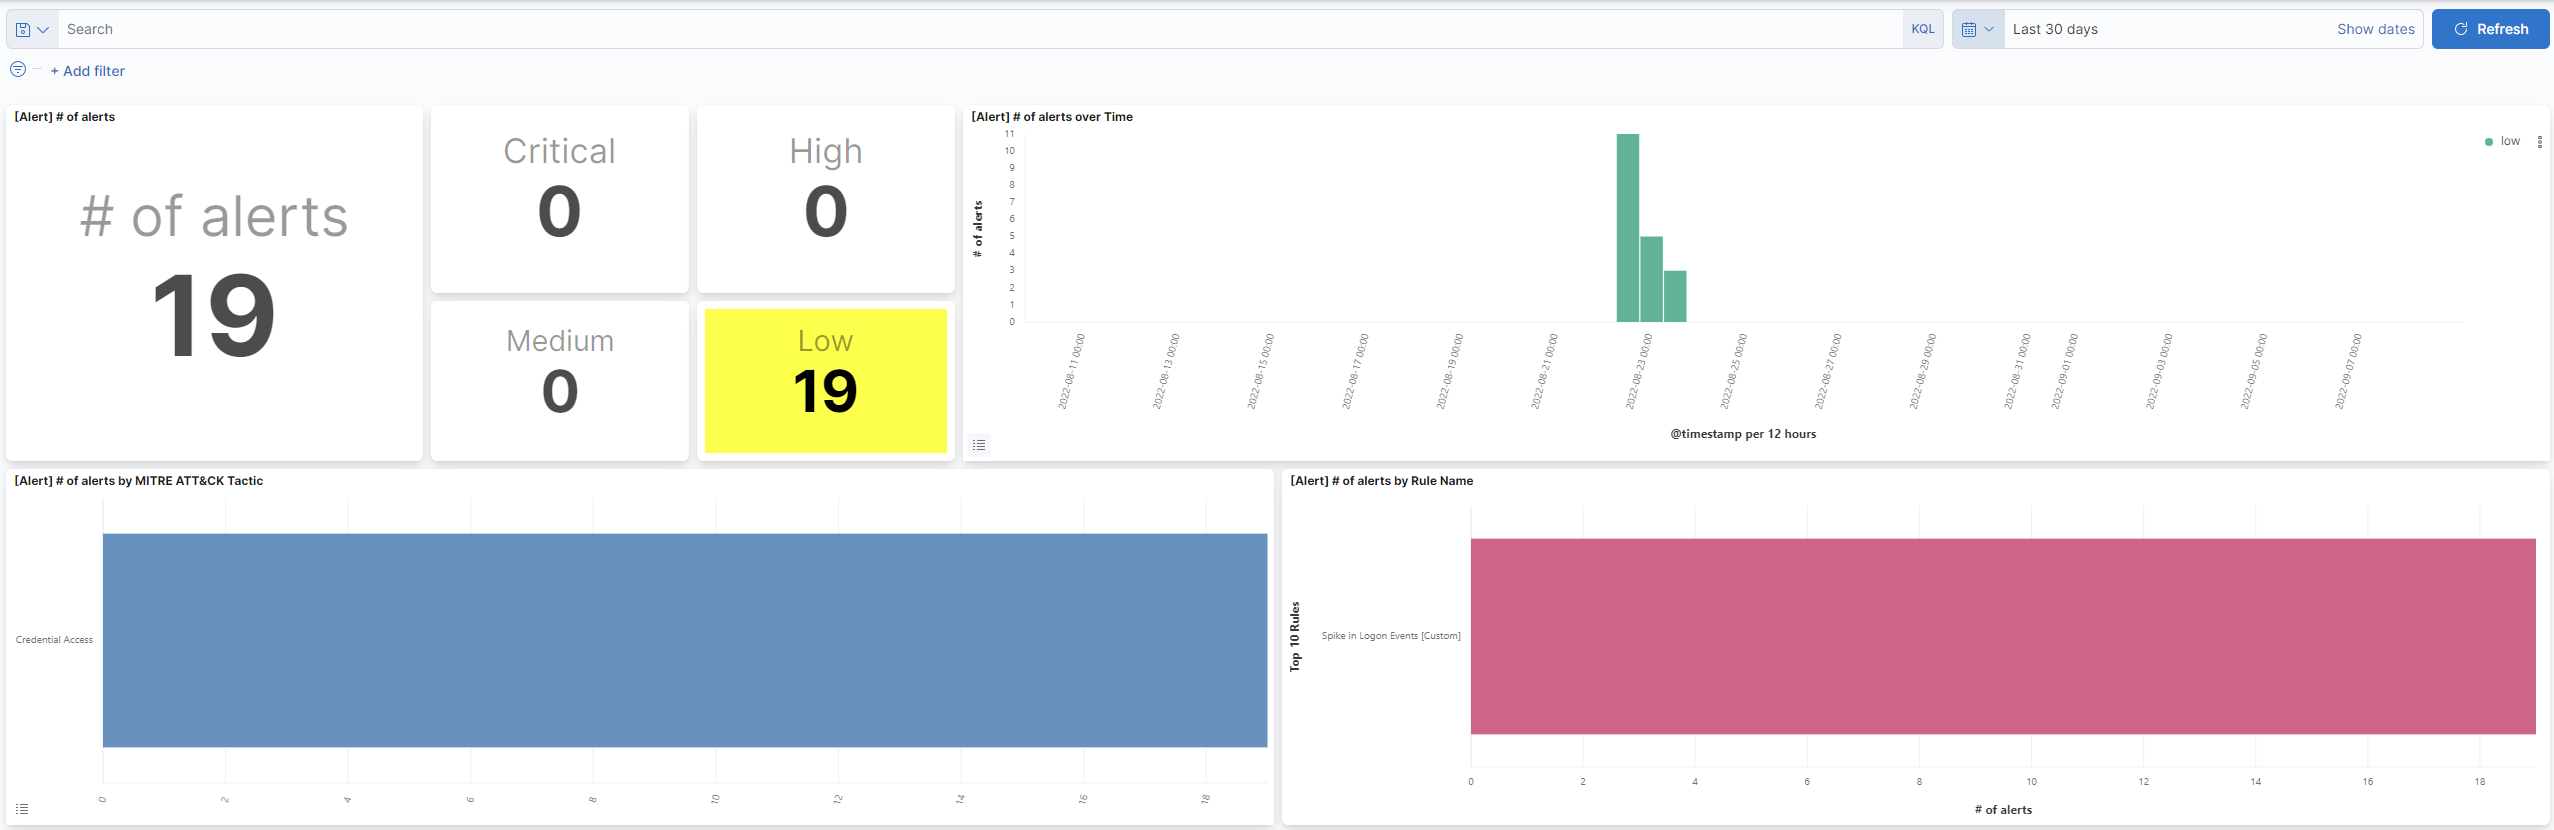
The dashboards are interactive and you can filter specific results by clicking on the histograms.
Events and Log sources
The second dashboard contains data relating to the number of events received by Elastic over the selected time period.
You can see how many and which hosts are sending data and the number of EPS (events per second) received.
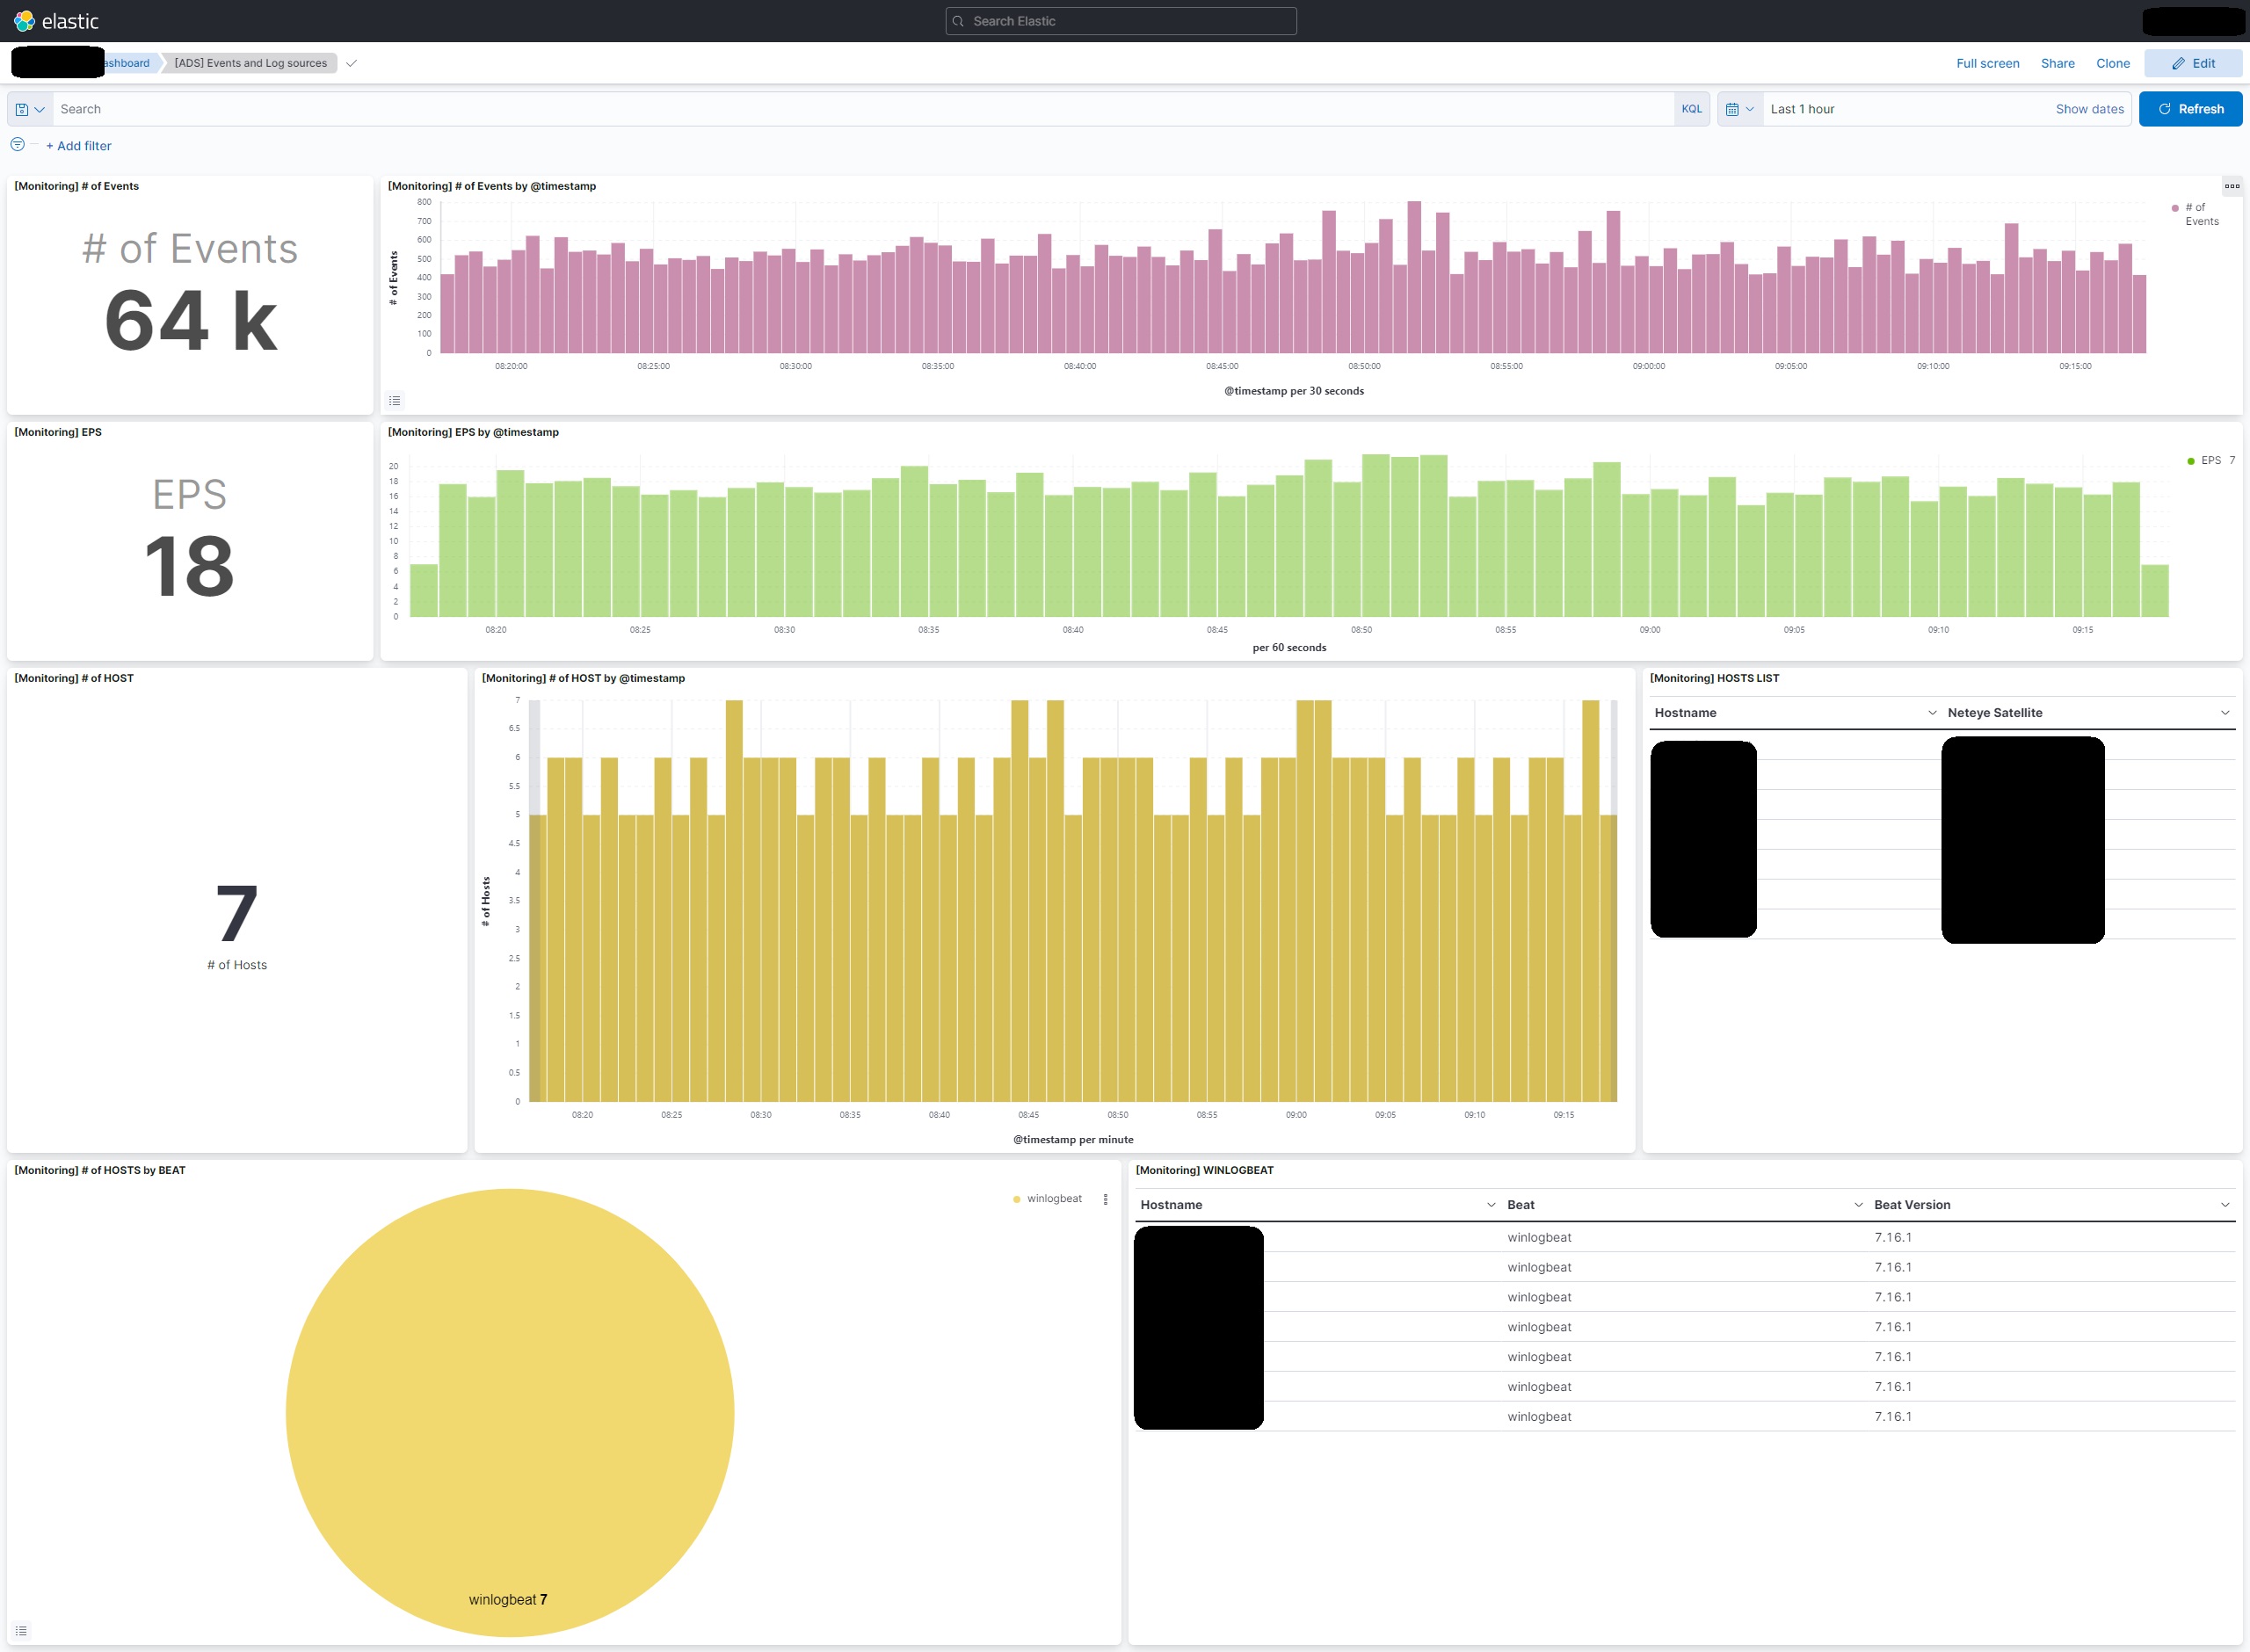
Here too, you can filter the data, for example by date or host, by clicking on the relevant items in the graphs.
ADS Overview
This dashboard is perhaps the most important for the ADS service. It allows you to easily and effectively monitor authentication events related to system administrators.
The central section displays, in tables and graphs, the usernames of the administrators who performed the most operations, the actions performed (such as logins, logouts, failed attempts), and the machines on which these activities occurred.
All data is updated in real time and provides a clear overview of administrative activity on the system.
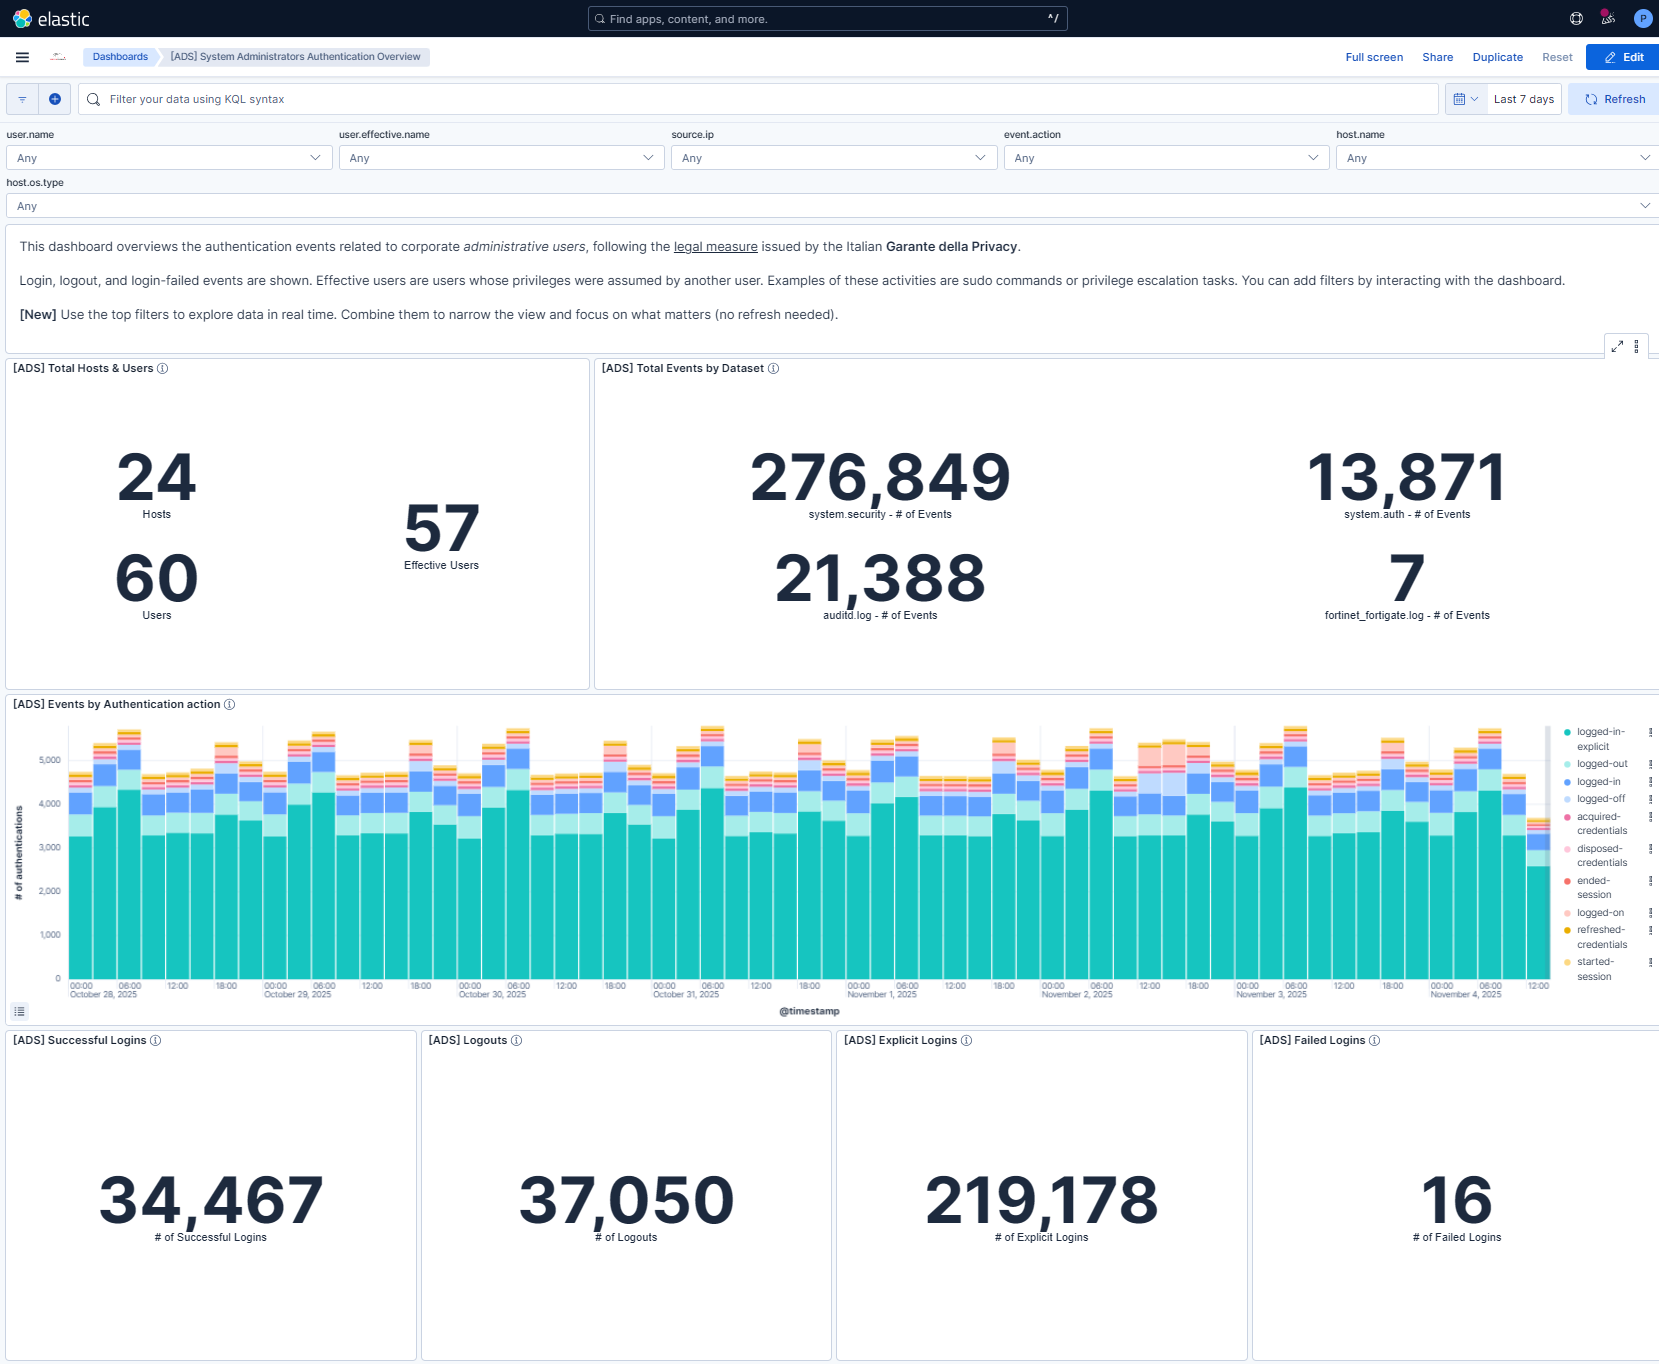
At the top of the dashboard there is a section of interactive filters, called controls, that allow you to explore data in a targeted and flexible way. These filters function as selectable boxes, within which you can choose one or more values to narrow the displayed results.
For example, selecting a certain user.name will display only events related to that specific user. Similarly, you can filter by source.ip to analyze accesses from a specific IP address, or event.action to focus on a particular type of action (such as SSH logins).
This user.effective.name can also be used to determine if the user has temporarily assumed another user’s privileges (as in the case of sudo commands), while host.name and host.os.type help narrow the search to a specific machine or operating system.
The controls structure is designed to adapt over time to the needs of the service, always maintaining a simple and accessible interface, even for those unfamiliar with the platform.

Using the controls is simple and intuitive; each filter can be used individually or in combination with others, allowing for highly precise navigation within the data. The results are automatically updated each time a value is selected or deselected, without the need to write queries or understand the log structure. This allows you to quickly find the information you need, for example, to respond to an audit request, investigate suspicious activity, or simply monitor administrator activity.
Note
All events in this dashboard are for system administrators only. If you’re interested in viewing other authentication logs (belonging to standard users), you’ll need to use the Discover feature, explained in the next chapter of this guide.